Enhancement of Collegiate Pitching Plus Model With Arsenal Coherence Effects
- Art Of W.A.R Technologies
- Mar 13, 2025
- 9 min read

Updated: Mar 21, 2025
(Link to Division 1 Arsenal + Rankings https://artofwar-technologies.shinyapps.io/Division1_Arsenal_Rankings/ )
Abstract
Pitching+ models have taken over baseball analytics as an advanced way to predict and evaluate pitching performance. Last year, we developed a set of Division III Stuff+, Location+, and Pitching+ models. Our Stuff+ quantifies the value of pitches in a vacuum, a simple way to evaluate pitch value. However, pitches do not exist in a vacuum. Pitchers rely on multiple pitches in conjunction to create an arsenal that can deceive hitters. Stuff+ evaluates the physical tools of a pitcher, but arsenal design is their blueprint for success. This project proposes a new way to quantify and evaluate arsenal coherence at the collegiate level.
Research on arsenal coherence has become a topic of growing interest. Marek Ramilo and Jack Lambert of Driveline released their Mix+ and Match+ statistics. Match+ is described as “how long pitches in a player's arsenal remain on the same trajectory.” (Link). They define Mix+ as “the ability to make things move in different ways.” (Link) Their work helped advance Pitching+ to evaluate a pitcher more comprehensively. Another similar approach was Dylan Drummey of Prospects Live, titled Arsenal+. Arsenal+ is described as a “Pitching+ metric on steroids” an evaluation dependent on changes from one pitch to another. (Link). Arsenal+ considers prior pitches thrown, another interesting technique to quantify arsenal.
We propose the quantification of arsenal coherence through the metric of Arsenal +. The purpose of our research into Arsenal + is to understand arsenal coherence at the college level in two ways. How do physical pitch interactions and pitch sequencing affect success in collegiate pitching? We found that the gap between pitchers' Stuff+ and their actual results can be largely accounted for by their ability to effectively command an arsenal.
Arsenal Points make Pitching+ a more complete statistic for evaluation, continuing to solve the problem of predicting future success with the smallest possible sample. Arsenal Points also increases detail for development with college pitching, and provides a quantitative understanding of what arsenals are most effective at the collegiate level. Using Arsenal Points as a foundation, pitchers can receive actionable insights for development beyond Stuff + development. This model is another piece to our final goal of creating publicly accessible and easy to use baseball analytics software to data drive baseball development around the country.
Redefining Run Values
The first part to creating quality models for player performance is to find a detailed measure of previous performance. Traditionally the best measure for pitching performance has been ERA, but we have now long passed by that tradition. Previously, we have created a Pitching + model for Division III college baseball, using FIP as our measurement for performance. This was done due to the size of our data. However, Art of W.A.R. 's data size has grown substantially in the past year. Collegiate run values which previously seemed impossible are now available to us. These run values were used in the Fall of 2024 to recreate our Stuff + Model. Run values simply take into account the value of each pitch a player throws. When breaking down value into each individual pitch, we are able to analyze past performance as accurately as possible.
Traditional run values simply take into account the outcome of each ball put into play (Flyball, Groundball, Linedrive, Popup), but that leaves nuance in the form of exit velocity.. While the launch angle of a batted ball is something to take into consideration, quality of contact also plays a major role in batted ball results. A 95 EV double in the gap is not more valuable than a slow ground ball simply because it is in the air, but also because it is hit hard. Hard hit balls typically mean a mistake from the pitcher, and should have a different run value than a ball hit softly.
In our research, we found 87 mph to be the optimal cutoff when delineating between soft and hard hit balls. This may feel like an arbitrary boundary, but there is numerical evidence to support this decision making. It is all in relation to the average wOBACON value for each exit velocity. As figure 1 below shows, when EV is below 87 mph there is a fairly flat slope in wOBACON. Then at 86.77 mph, the slope begins to increase. Thus the barrier is placed there.

Other than that distinction our method for calculating run values remains fairly standard. Averages for each outcome were calculated using a set of data from both Division III and Division I games. Our run values are shown in table 1 below.
Result Type | Pop Up Soft | Strike Called | Pop Up Hard | Strike Swinging | Foul Ball | Fly Ball Soft | Ground Ball Soft | Ball |
Run Value | -6.6 | -6.2 | -6.1 | -6 | -2.3 | 6.1 | 6.2 | 9.1 |
Result Type | Ground Ball Hard | Hit By Pitch | Line Drive Soft | Fly Ball Hard | Line Drive Hard |
Run Value | 19.5 | 45.7 | 31.6 | 33.8 | 42.7 |
Table 1: Table displaying Run Values for each pitch outcome with adjusted approach
The Role of Physical Interaction
(Supplemental charts may be found at end of paper)
One way that a coherent arsenal can be quantified is through the physical interactions between a player's primary pitch and each of their secondary pitches. This is commonly referred to as “tunneling”. However, to properly model the effectiveness of pitch tunneling, we first need to quantify the effects of different tunnels.
Our decisions for modeling were all based around using a similar system to the Stuff + models we have created in the past. However, differently to that model we measured each metric in relation to that player's Fastball. Based on our data we felt it made sense to separate secondary pitches into three groups, Sliders, Curveballs, and Offspeeds. The following table displays how we divided up pitch categories. It is also important to note that secondary fastballs such as sinkers, two seamers etc were tested and removed due to sample size.
Pitch Classification | Members of Pitch Group |
Slider | Slider, Cutter |
Curveball | Curveball |
Offspeeds | ChangeUp, Splitter, Forkball |
Table 2: Table displaying the groupings of each secondary pitch into their larger categories
From there we determined a set of variables to use in our model. We started with traditional thrown ball metrics and transformed them into variables of percent change from the fastball metrics. We took metrics for each secondary pitch and subtracted them from that player's Fastball metrics. dividing that difference by the Fastball metric, calculates a percent difference in the pitches physical movement, release, velocity, and spin. This creates variables like horizontal break difference which shows the extent at which the secondary pitch moves differently from that player's fastball. All of the metrics in the physical interaction work this way except the angle metric.
The angle metric requires a little geometry, but remains conceptually straightforward. To calculate this metric take the straight line from a pitchers fastball to the offspeed on a typical break chart. Then create another line from that offspeed pitch to the origin of the graph. Find the interior angle between those two lines. That angle's degree value is this metric. We have previously hypothesized that the angle metric quantifies some efficiency in how two pitches move away from one another, or tunnel. In previous research we have found correlations to this metric and secondary pitch success. Hence its inclusion in the physical interaction model.

Next we create a detailed set of models which explain the effects of pitch interaction on preventing runs. A machine learning program, XGBoost, was utilized to construct these models. A model unique to each pitch was run. Overall we found each of those models to be very accurate given our data. Here is a series of visuals displaying our individual pitch results.


Variable | RMSE | 3-Fold CV RMSE | MAE | 3-Fold CV MAE |
Curveball | 3.31 | 3.61 | 1.73 | 1.87 |
Offspeed | 3.75 | 4.46 | 2.19 | 2.57 |
Slider | 3.15 | 3.70 | 2.24 | 2.57 |
Table 3: Table displaying the numeric results of each pitch specific model. RMSE around 3 typically represents a level of accuracy given data size.
Results, both visually and numerically indicate a large amount of predictive success for the physical interaction models. The visuals may speak for themselves, but RMSE indicates that each pitch by pitch model does a very good job of holistically predicting the tunneling effects on a player’s success. RMSE here is in units of Run Values indicating that our mean error for all models is around 3 RV.
Putting Individual Pitch Models Together
The pitch specific models look good. However, this wouldn’t be a real arsenal model if these models themselves didn’t cohere. A full model allows us to not only understand the tunneling value of each pitch, but see how the entire arsenal of a pitcher works together to deceive hitters. To do this, a second level of model is introduced to quantify the value of adding each pitch into an arsenal. But where is the cutoff for a pitch being part of a player's arsenal? We have two criteria in order for a pitch to be “qualified”. First, it needs to be thrown at least 5% of the time, and second the pitches Stuff + must be at least an 80 in our collegiate model. If a player doesn't trust the pitch enough to throw it 5% of the time then hitters probably aren’t worried about that pitch all that much, and the same is true if a pitch has stuff below two standard deviations of average. Getting an arbitrary boost in Arsenal Coherence for throwing a bad 4th pitch 2% of the time didn’t seem right, so these criteria were added.
From there, another XGBoost was run to find proper values for the addition of any secondary pitches. Table 4 below shows the gain that adding any of these pitches to an arsenal has, determining each of the secondary pitches respective values in comparison to each other.

The above table highlighted specific insights of the model, in conjunction with our Stuff + model, throwing a hard bullet slider remains to be the best offspeed pitch in college baseball regardless of level of play. However, this does not mean that this pitch belongs in every pitcher’s repertoire. Every pitcher is different and requires an individualized approach to optimizing their pitch mix. This research serves as a tool to guide this process.
Before moving on it is important to analyze the results of the full model after putting everything together. The two leveled models were applied in conjunction using a weighted average, forming a final ‘Physical Interaction’ or ‘Tunnel +’ metric. Results indicate that this model remains a high level of predictive accuracy.

Variable | RMSE | 3-Fold CV RMSE | MAE | 3-Fold CV MAE |
Full Model | 12.11 | 12.09 | 8.83 | 8.85 |
Table 4: Table displaying numeric results of full physical interaction model
The Role of Sequencing
(Full Sequence + results may be found at end of paper)
While possessing an elite arsenal does a great job of setting a pitcher up for success, they need to be able to effectively utilize that arsenal to succeed. We can quantify trends in usage with Sequence +. Sequence + analyzes pitch selection using in-game context to determine how effective a certain pitch is in each given state.
The main point of context that pitchers are beholden to is the count. Each of the 12 unique counts carries their own impact on the game state. An 0-2 slider will likely bring about a different result than a 3-0 slider, even if the pitches are thrown in the same spot with the same physical characteristics. To account for this, we created 3 count-states from the 12 available counts. A pitch may be thrown from the ahead, even, or behind in the count. This grouping was done to ensure that each count state had a large enough sample size to be statistically viable.
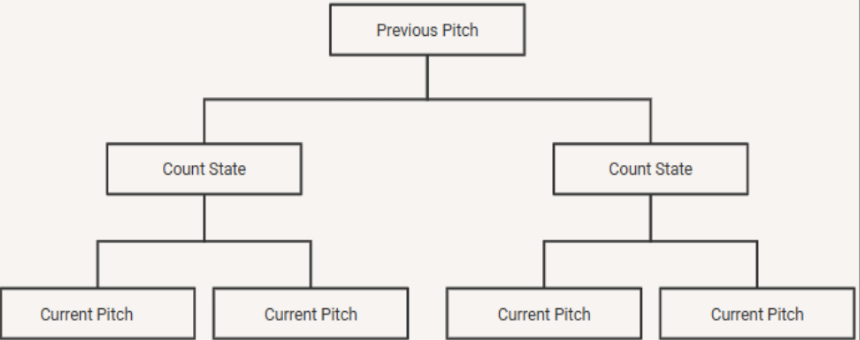
The other point of context we used in this research was the prior pitch. Hitters often make guesses on what they believe will be thrown next, due to previous information. One of the main clues is the last pitch that the hitter saw. While this game of cat and mouse goes well beyond just the previous pitch, we found observing sequencing through this lens provided significant results.
By combining both the count state and previous pitch, we were able to develop a model to quantify Sequencing at the collegiate level. We utilized an xGBoost model, comparing each unique pitch-and-count state against baseline Run Values in a count vacuum. We were able to determine significant benefits that are useful in helping instruct pitchers in how to utilize their arsenal. Figure 8 below shows a visual representation of the decision making tree of our model.
One of the most interesting results was the high value of throwing a slider-slider sequence when behind in the count. Throwing a slider when behind in the count seems to fly in the face of traditional baseball wisdom, but our model found that this combo can prove to be incredibly effective. The model found the slider-slider combo to be effective in all situations, aligning with our research into importance quality. When utilized effectively, a good slider can be an incredibly important tool in a pitcher’s arsenal.
The sequencing model we ran was entirely characteristic agnostic. We did not take into account the physical qualities of a pitch, looking solely at its performance in the game state. This was done to avoid any additional statistical noise stemming from these variables. Sequence + is meant as a tool to be used in conjunction with Arsenal + to help guide pitchers towards their best selves. Where Arsenal + may be the ingredients, Sequence + can be seen as the cookbook.
Supplemental Charts


Sequencing Outcomes


Comments