Digital HomeBase: A Unified System for Data Collection, Storage, and Analysis for Pitching
- Art Of W.A.R Technologies
- Aug 3, 2025
- 3 min read

Digital HomeBase: An Art of W.A.R. Product
Digital HomeBase helps your program get the most out of the data you collect, whether that is importing Trackman or Rapsodo or charted directly within our platform. Our software combines intuitive charting with advanced analytics and machine learning models to act as a digital assistant for your coaching staff. The application delivers streamlined reports, visualizations, and insights that drive player development and coaching decisions. Designed to maximize the value of your existing data at a low cost, Digital HomeBase saves you time and turns your data into a competitive advantage. This document outlines how the system works and what it can do for your program.
The Charting Tab
The ‘Charting’ tab provides a way for charting games as they happen. Outings are generated at the end of the game, displaying statistics for each pitcher. This tab allows teams with minimal technology to generate advanced statistics for analysis.

Interactive Database
The ‘Interactive Database’ tab has a variety of tables: Summary Statistics, Overall Modeling, Pitch-Level Modeling, Location, Batted-Ball, Pitch-Level, Pitch Metrics, and Totals. The Base Statistics table features overall summary stats that can be used to get a broad overview of pitcher performance.

The Base Modeling table has a variety of machine learning models used to evaluate pitchers; specifically, it has models that evaluate pitch quality based on raw metrics (Stuff+), location (Location+), and overall ability (Pitching+). Our Stuff + model utilizes physical characteristics of each pitch to grade its value in expected Whiff% and expected wOBA on contact.

The Pitch Level Modeling table allows for examining the above models for each individual pitch, as well as a Tunnel + model for evaluating arsenal coherence.

The Location table allows users to see location-specific statistics, such as strike %, FPS% (First Pitch Strike), and 2 of 3 Strike % (defined as % of at bats where the pitcher throws strikes in 2 of the first 3 pitches).

The Batted Ball table features statistics on the batted-ball types a pitcher has given up.

The Pitch Level Table provides statistics such as Whiff% and CSW% on the individual pitch level.

The Pitch Metrics table displays each pitcher’s metrics, while the Totals table displays the raw totals for each player.

Data Imports and Reports
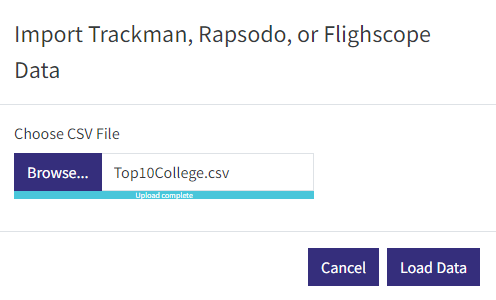
The ‘Data Imports and Reports’ tab allows for two things: importing data from Rapsodo, Flightscope, or Trackman and downloading reports for the team and individual players. This assists the user with maximizing technology such as Trackman or Rapsodo and creating downloadable reports. Sample reports are available at this link. (https://artofwartechnologi.wixsite.com/art-of-war/post/homebase-sample-reports)


Data Visualization
The ‘Data Visualization’ tab generates a variety of plots to help understand and evaluate players. Our percentile plot uses data from the selected player along with
Division 1 averages and standard deviations from the last 3 years. Division 1 Averages and Standard Deviations can be found here.
Metric | Average | Standard Deviation |
FIP | 6.29 % | 1.72 |
Stuff+ | 100 | 10 |
Location+ | 100 | 10 |
Pitching+ | 100 | 10 |
Whiff % | 23.5 % | 6.5 |
Strikeout % | 20.6 % | 6.7 |
Walk % | 11.8 % | 5.2 |
Home Run % | 3.1 % | 2.0 |
Strike % | 59.4 % | 5.7 |
First Pitch Strike % | 57.3 % | 6.6 |
The next plots are usage plots: overall pitch usage and usage based on the batter’s handedness. Break and release plots are also available with expected arm angle based on release characteristics displayed on these plots. Velocity Distribution plots allow users to see the frequency at which players are throwing pitches at certain velocities. The rolling Stuff+ visual displays the Stuff+ of the selected pitcher for each outing throughout the year. The heatmap plot visualizes the distribution of pitch location.


Pitch Query
The ‘Pitch Query’ tab allows the user to query their pitch-by-pitch data for specific conditions. For example, if you would like to know how effective your ace has been at throwing sliders to lefties on the first pitch, this tab allows you to investigate that.


Comments