Applying Break Charts for Pitching Development: Introducing DDB and OAB
- Art Of W.A.R Technologies
- Sep 15, 2024
- 5 min read

Introducing Break Charts
Break charts are standard visuals used for analysis of pitching data. Many baseball technologies including our Pitching + Server, utilize this chart to display and convey data to users. Beyond just looking at these charts, we can apply analytical techniques to transform these charts into great development tools. This paper introduces two analysis techniques– Distance Between Breaks (DBB), and Opposed Angle of Breaks (OAB)- which can enhance understanding of pitch shape, and how shaping can be used to refine a quality arsenal of pitches.
For those unfamiliar with break charts, they display the average vertical and horizontal breaks of each pitch in a player's arsenal. Vertical breaks are typically displayed in terms of induced vertical break, the spin induced movement when gravity is accounted for. These breaks are generated based on the spin that a player applies, and the angle at which the spin is applied.

Figure 1. A typical break as displayed in the Pitching + Server.
What are we looking for?
Visually we assess several aspects of the break chart to determine the quality of a player's arsenal and identify areas for improvement. We begin with the Fastball.
For the Fastball break charts serve as an evaluation tool rather than a development guide. Typically Fastball breaks are more strictly influenced by arm slots, and arm actions as a whole. While it is possible to quickly make small tweaks to break profiles. Significantly reshaping a Fastball shape requires overhauling a player’s pitching motion, leading to potential issues with command, or injury proneness. Additionally adjustments of that scale require immense time and practice. Especially below the Division 1 college level, for a lot of cases it makes more sense to focus on adding velocity without worrying much about shape. Below is a chart from a large database of D3 pitchers showing average whiff rates by break shape.

Figure 2. Whiff rates for Fastball shapes for large amounts of D3, indicating that other factors may have more impact on performance.
This chart is not to dissuade from the importance of breaks amongst pitches, creating more break in both directions has been shown to lead to more whiffs at all levels of college and professional play. However, based on this chart and other analysis at most levels it seems to be more productive to focus on other Fastball traits such as velocity and raw RPM’s instead of spending months making large scale shape refinements. At least until the pitcher reaches a high velocity threshold. However, If one wants to refine shape, the goal is to keep vertical break away from horizontal break. A Fastball profile that is either very vertically dominant or very horizontally dominant. Commonly this is referred to as keeping your Fastball out of the “Dead Zone” where vertical and horizontal breaks conflict to create a flatter appearing pitch.
Most secondary pitch shaping work should be done based off of a player's Fastball movement profile. While specific shapes of breaking balls or changeups can play better than others, their success is often based on being able to work off a pitcher's Fastball.
Since the birth of Art of W.A.R, we have held one belief as the foundation of all pitching development. You can’t improve something efficiently if you don’t measure it. Quantification is the first step to development. Currently our Stuff + modeling looks at each pitch in a vacuum, but does not consider the value of each pitch when combined with others. We aim to introduce a series of analytics which can measure and evaluate how effectively a pitcher is able to mesh their arsenal together.
Introducing Distance Between Breaks (DBB)
One method for quantitatively analyzing break charts is to measure the distance between the pitcher's primary pitch, and each secondary pitch. That Distance Between Breaks (DBB) indicates how effective a pitcher is at differentiating their pitches in break. For breaking balls it’s generally understood that you want to shape the pitch in the opposite direction of a pitcher's primary pitch. The better a player’s raw distance is on the break charts in theory the better they do at tunneling these pitches, and creating swing and miss stuff.

Figure 3. A break chart visualizing the idea of Distances Between Breaks.
This Distance Between Breaks (DBB) metric can be used as a simple way to quantify a pitcher's ability to create break separation and tunnel their pitches. While it is not the one metric which leads to more swing and misses, it is a peripheral that can aid with refining arsenals. Here is a chart of the relationship of this DBB metric graphed against Whiff rates.

Figure 4. The relationships between the Distance Between Breaks metric and Whiff rates for breaking balls.
Although this chart does not control for Stuff+ or general pitch quality which would give a more detailed analysis, the general slope appears to be positively correlated. When applied as a tool for pitch shaping, we would hope it aids a player towards throwing effective breaking balls. While it is not a metric to directly chase in training, it can operate as a good peripheral to contextualize what development is needed.
Introducing Opposed Angle of Breaks
Beyond just the raw difference in break, the angle at which pitches diverge– the Opposed Angle of Break (OAB)- is another metric that can aid in pitch shape development. By measuring the angle between the fastball and each secondary pitch relative to the origin on the break chart, we can assess how directly a pitch tunnels away from the primary pitch. Here is what that would look like on the break chart.

Figure 5. A break chart displaying the Opposed Angle of Breaks (OAB) metric, with red lines representing the movement vectors of secondary pitches from the origin.
The angle of OAB exists in between the red and black lines. This can indicate how directly a pitch tunnels away from the primary pitch. Now this is not to say each pitch would be optimized with an angle of 0. This metric should be further studied, and in time be used to understand more about pitch shaping. A quantification tool of tunneling, showing which angles fare the best for breaking balls of particular movement profiles, or how one should approach shaping a changeup. Here is a preliminary chart showing the linear relationships between OAB and Whiff Rates.
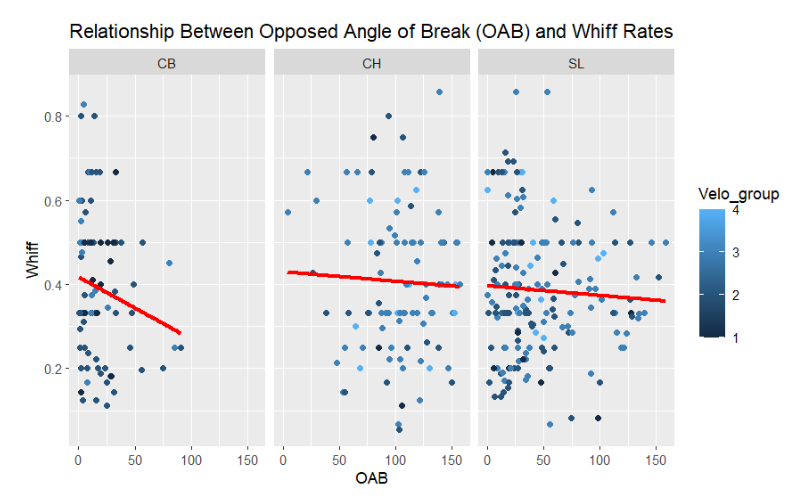
Figure 6. The relationship between OAB and whiff rates for commonly thrown secondary pitches, color-coded by velocity groupings.
This chart shows that there is a potential relationship here between generating swings and misses, and having lower values of OAB for each pitch. I would propose these relationships are a lot more complicated than a linear model could show. Additionally, again after normalizing for pitch quality, or Stuff we would hope to see a more clear relation.
We hope this article is useful to players, coaches, and baseball enthusiasts. Our goal with this is to encourage deeper consideration of what break charts represent, and to strengthen the connection between publicly accessible baseball analytics and player development. Employing simple quantification like DBB or OAB for quality development. While these metrics are no miracle solution in pitch shaping development, hopefully it is a step towards better data driven development. At AoW, we aim to develop a comprehensive model for pitch interaction. Potentially called Arsenal Points, which rewards pitchers for effectively tunneling their pitches, thereby affecting their AoW Stuff +. We hope to eventually introduce these metrics along with further analysis in pitch to pitch interaction into our server throughout the near future.


Comments